Understanding RAG Performance Metrics: A Beginner's Guide to Measuring AI Quality
All RAG performance metrics explanation.
Understanding RAG Performance Metrics: A Beginner’s Guide to Measuring AI Quality
Imagine asking a medical AI assistant about treatment options for a condition, and it confidently recommends a medication that doesn’t exist—or worse, one that could be harmful. This isn’t science fiction. It’s a real risk when AI systems called RAG (Retrieval-Augmented Generation) aren’t properly monitored. Unlike traditional software that crashes when something goes wrong, RAG systems can quietly degrade, producing increasingly unreliable answers while appearing perfectly functional.
RAG systems are the technology behind many AI assistants you use today—chatbots that answer customer questions, virtual research assistants, and AI-powered search tools. They work by finding relevant information from a knowledge base (like searching through documents) and then using that information to generate natural-sounding responses. It’s like having a super-fast research assistant who reads thousands of documents and summarizes answers for you. But here’s the catch: without proper measurement, you have no way to know if that assistant is finding the right documents, understanding them correctly, or making up facts.
In this guide, we’ll break down the essential metrics that teams use to evaluate RAG systems in 2025. You’ll learn about the “three windows” approach to measuring quality—checking how the system finds information (retrieval), how it uses that information (generation), and how well the complete system performs (end-to-end). By the end, you’ll understand why each metric matters, what “good” looks like with concrete numbers, and why continuous monitoring has become non-negotiable for any organization using RAG technology. No technical background required—we’ll use simple analogies and real-world examples throughout.
What is RAG and Why Measure It?
Retrieval-Augmented Generation (RAG) is a pattern that combines two capabilities: searching for information and generating human-like text. Think of it as giving an AI assistant access to a library card. Without RAG, an AI can only answer questions based on what it learned during training—which means its knowledge becomes outdated the moment training ends. With RAG, the AI can search through current documents, company databases, or research papers before answering, making it far more useful for real-world applications.
Here’s a simple analogy: imagine you’re a research assistant for a busy executive. When they ask a question, you need to (1) find relevant reports from the filing cabinet, (2) read and understand those reports, and (3) summarize the answer clearly. RAG systems work the same way. The “retrieval” part is like searching the filing cabinet, and the “generation” part is like writing the summary. Just as a human assistant can mess up by pulling the wrong files or misunderstanding what they read, RAG systems can fail in similar ways.
So why does measurement matter? Unlike traditional software where failures are obvious (the app crashes, you get an error message), RAG systems fail silently. A chatbot can confidently tell you that a product feature exists when it doesn’t, or cite a policy that was updated months ago. These “hallucinations” look just like correct answers to users. Without proper metrics, you’re flying blind—you have no idea if your AI assistant is helping or causing problems.
The consequences can be serious. In healthcare, a RAG system that hallucinates medication information could endanger patients. In finance, incorrect investment advice could lead to losses. Even in customer service, wrong information damages trust and creates extra work for support teams. That’s why organizations building RAG systems in 2025 treat evaluation as a fundamental requirement, not an afterthought.
The Three Windows of RAG Evaluation
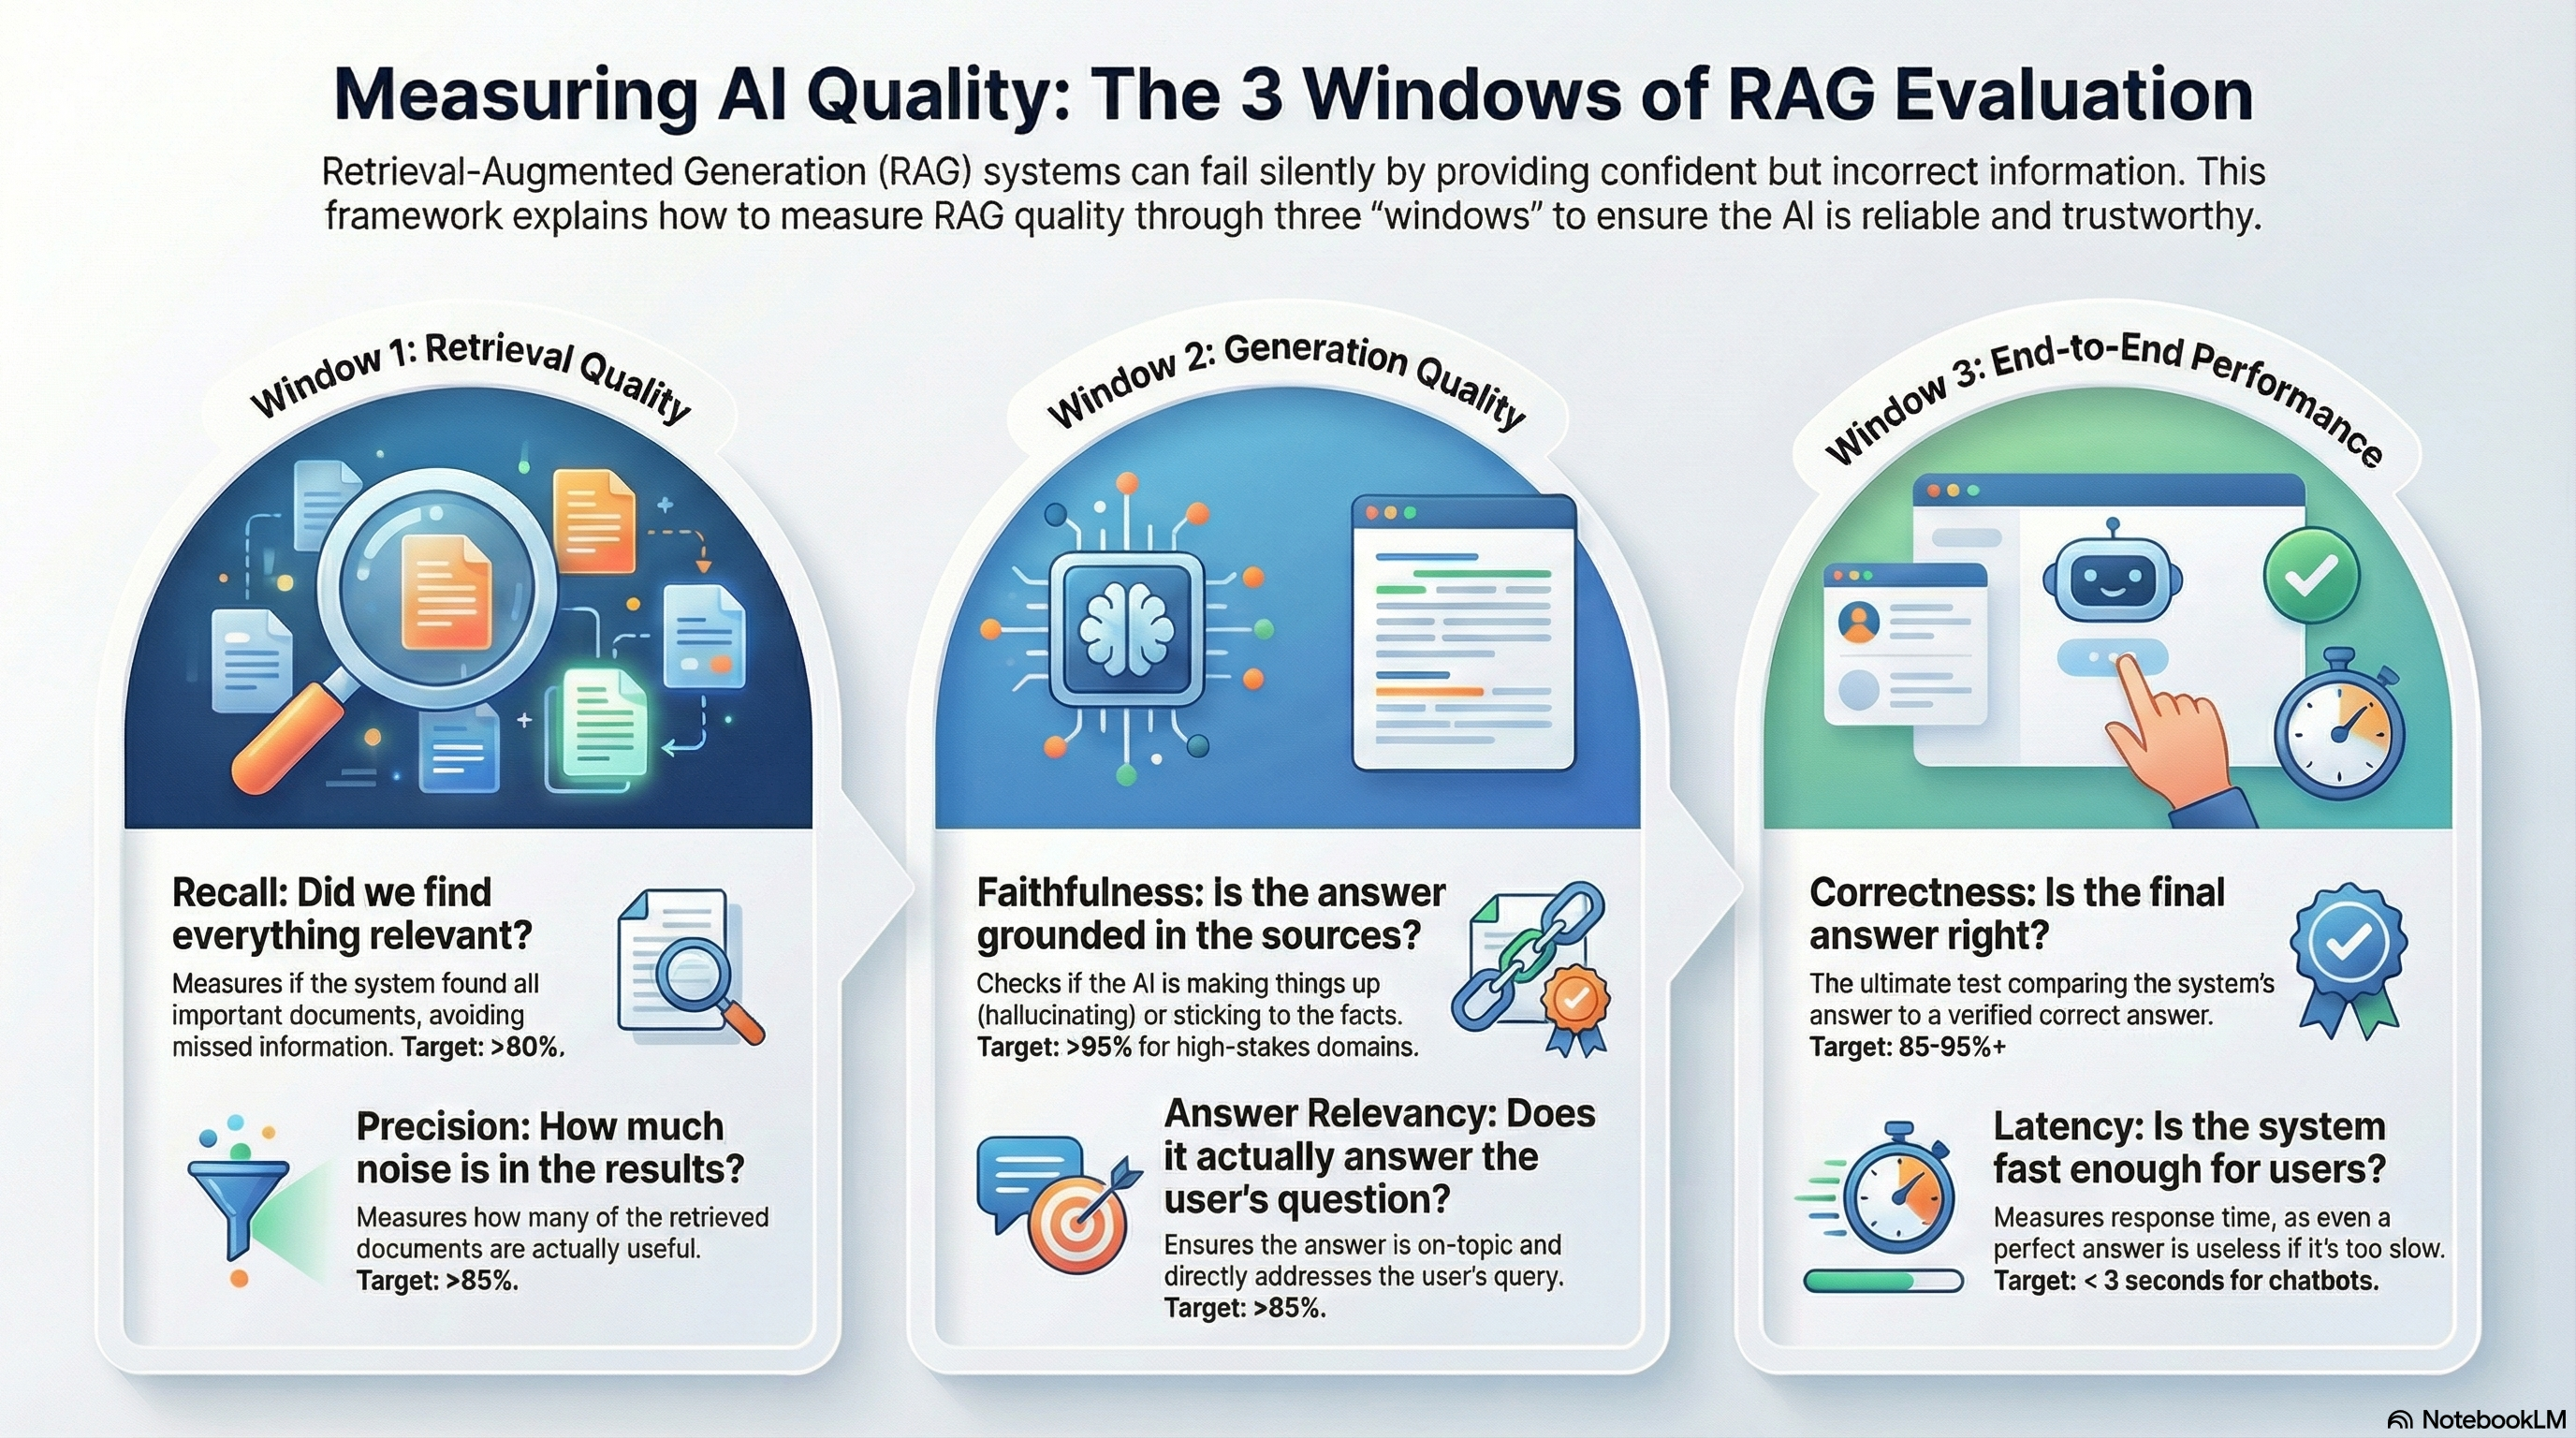
To properly evaluate a RAG system, you need to look through three different windows, each showing you a different part of the process. This is the core framework that professional teams use.
Window 1: Retrieval Quality - Did the system find the right documents? Imagine your research assistant goes to the filing cabinet and comes back with 10 folders. Before they even start reading, you can check: “Did you grab the folders I need? Did you miss any important ones? Are half of these irrelevant?” This is what retrieval metrics measure. If your RAG system retrieves the wrong documents, even the smartest AI can’t generate a good answer because it’s working with bad information.
Window 2: Generation Quality - Did the system use those documents correctly? Now your assistant starts reading those folders and writing a summary. You need to check: “Is this summary based on what’s actually in the folders, or are you making things up? Did you answer my actual question, or go off on a tangent? Are you citing your sources so I can verify?” This is what generation metrics measure. Even if the system found perfect documents, it can still fail by misinterpreting them or hallucinating facts.
Window 3: End-to-End Performance - How well does the complete system work in practice? Finally, you evaluate the entire process: “Is the final answer correct? How long did this take? Was it worth the cost?” These metrics capture the user experience and business viability. You could have excellent retrieval and generation in isolation, but if the system takes 30 seconds to respond, users won’t tolerate it.
Here’s why you need all three windows: imagine your end-to-end measurement shows answer quality dropped from 90% to 75%. That’s bad, but it doesn’t tell you what to fix. Is the search function pulling wrong documents? Is the AI misreading correct documents? Without component-level metrics, you’re debugging blind. It’s like trying to fix a car when the dashboard only has one light that says “something is broken”—not very helpful. The three-window approach tells you exactly where the problem is so you can fix it efficiently.
In a real-world example from 2024, a healthcare RAG system showed declining quality. By checking each window separately, engineers discovered the retrieval component’s recall had dropped from 84% to 68% after switching to a new search model. The generation component was working perfectly—it was just given the wrong documents to work with. They fixed it in 48 hours by rolling back the search model, something that would have taken weeks of blind experimentation without component-level metrics.
Retrieval Metrics: Finding the Right Information
Retrieval metrics answer a simple question: “Did we find the documents we need?” But measuring this requires several different angles, each revealing something important about search quality.
Recall@k: Did we find everything relevant? Recall@10 measures what percentage of relevant documents appear in your top 10 search results. If there are 5 documents that could help answer a question, and your system only retrieves 3 of them in the top 10, your Recall@10 is 60% (3 out of 5). Think of recall as measuring what you didn’t miss. High recall (above 80%) means the system rarely misses important information. Low recall means you’re leaving crucial context on the table, like a student who only reads half the required articles before writing an essay.
Real-world example: A legal research RAG system initially had 72% Recall@10. This meant that for every 10 legal queries, the system was missing nearly 3 relevant case precedents. Lawyers using the system couldn’t trust it because they had no way to know what was being left out. After fine-tuning the search model on legal terminology, recall improved to 89%, making the system actually useful in practice.
Precision@k: How much noise is included? Precision@5 measures what percentage of your top 5 results are actually relevant. If your system returns 5 documents but only 4 are useful, Precision@5 is 80%. Think of precision as measuring the signal-to-noise ratio. Low precision (below 70%) means users have to sift through lots of irrelevant results, like getting restaurant recommendations where half are actually furniture stores. Target precision above 85% for most applications.
The balance between recall and precision matters. You could achieve 100% recall by returning every single document in your database—but precision would be terrible. You could achieve 100% precision by returning only one highly relevant document—but recall would be awful. The best RAG systems optimize for both, typically targeting 80%+ recall and 85%+ precision.
nDCG: Are the best results ranked first? Normalized Discounted Cumulative Gain (nDCG) is a mouthful, but the concept is simple: ranking matters. If your system finds all the right documents but puts the most important one in position #10, that’s worse than putting it in position #1. Users (and the AI reading those documents) pay more attention to top results. nDCG scores range from 0 to 1, with higher being better. Professional systems target nDCG above 0.80. Think of nDCG like ordering search results on Google—finding all the right pages doesn’t help if the best one is buried on page 5.
These metrics work together to give you a complete picture of retrieval quality. A system with 95% precision but 60% recall is missing critical information. A system with 90% recall but 65% precision is drowning users in noise. And a system with good recall and precision but poor nDCG is burying the most important information. In 2025, monitoring all three has become standard practice for production RAG systems.
Generation Metrics: Using Information Correctly
Once your RAG system has retrieved the right documents, the next challenge is using them correctly. Generation metrics measure how well the AI transforms retrieved context into useful answers.
Faithfulness: Is the answer grounded in retrieved sources? Faithfulness measures whether every claim in the generated answer can be traced back to the retrieved documents. It’s the metric that catches hallucinations—those confident-sounding but completely fabricated statements that AI systems sometimes produce. Faithfulness scores range from 0 to 1, where 1.0 means every single claim is supported by the source documents.
Think of faithfulness like fact-checking a news article against its cited sources. If a reporter writes “The study found that 75% of participants improved,” but the actual study says 60%, that’s not faithful to the source. Similarly, if your RAG system says “The policy requires manager approval” when the retrieved document never mentions approval requirements, that’s a faithfulness failure.
In practice, general-purpose RAG systems should maintain above 90% faithfulness. For high-stakes domains like healthcare, legal, or financial advice, the bar is higher—95% or above. A financial advice RAG system serving customers with millions in assets can’t tolerate even 1% hallucination rate; the liability is too high. Teams measure faithfulness using “LLM-as-judge” techniques, where another AI model reads both the retrieved context and generated answer to verify alignment, or by using specialized tools like the RAGAS framework.
Answer Relevancy: Does this actually answer the question? You can have a perfectly faithful answer that’s completely off-topic. If someone asks “How do I reset my password?” and the system provides a faithful summary of the password policy document without actually explaining the reset steps, that’s poor answer relevancy. This metric measures how well the response addresses the actual query, typically scored 0 to 1, with targets above 85%.
Answer relevancy failures often happen when the retrieval system finds related but not quite relevant documents. Imagine asking your research assistant about “2024 sales growth in Asia” and they give you a detailed report about European sales from 2023—factually accurate but not what you needed. Good RAG systems optimize prompts to ensure the generation focuses on answering the specific question, not just summarizing whatever documents were retrieved.
Hallucination Rate: How often does the AI make things up? This is the inverse of faithfulness—measuring the percentage of queries where the system generates unsupported claims. While faithfulness measures the proportion of each answer that’s grounded, hallucination rate measures how many answers contain any fabrication at all. Best practices in 2025 recommend keeping hallucination rate below 1% for general applications and below 0.5% for specialized domains.
Recent advances in detection have made measuring hallucinations more reliable. Tools like Vectara’s HHEM-2.1-Open model and Lynx (which outperforms earlier tools on long-context scenarios) can automatically flag potential hallucinations. However, as of 2025, complex queries still require some human review, as automated detection isn’t perfect.
Citation Coverage: Can users verify the sources? In many applications, especially professional or regulated domains, users need to verify where information comes from. Citation coverage measures what percentage of claims include source attribution—like “[Source: Product Manual v2.3]” or “According to the 2024 compliance guide…”. For legal and medical RAG systems, citation coverage above 90% is essential. Even general applications benefit from citations, as they build user trust and enable verification.
The key insight: generation metrics reveal whether your AI is a reliable research assistant or a creative writer making things up. In production, teams monitor these metrics continuously because generation quality can drift as models are updated or as the underlying data changes.
End-to-End Metrics: The Complete Picture
While component-level metrics (retrieval and generation) help you debug problems, end-to-end metrics tell you whether the complete system actually works for users in practice.
Correctness: Is the final answer right? This is the most straightforward metric—comparing generated answers against known correct answers (called “ground truth”). If you have a test set of 100 questions with verified answers, correctness measures how many the RAG system gets right. Professional systems typically target 85%+ correctness, though this varies by domain. Medical and legal applications often require 90-95% due to higher stakes.
Measuring correctness requires building “gold datasets”—collections of questions with human-verified correct answers. This is time-consuming but essential. In 2025, many teams bootstrap these datasets by having domain experts review and correct AI-generated examples, then manually verifying a sample. While automated generation is faster, over-trusting synthetic data without human verification is a common pitfall that leads to false confidence.
Latency: How fast is it? Even a perfectly accurate system is useless if it takes 30 seconds to respond. Latency measures response time, typically broken down by percentiles: p50 (median), p95 (95th percentile), and p99 (99th percentile). For interactive applications like chatbots, p95 latency should generally be under 2-3 seconds. Batch processing systems can tolerate more latency. The reason for percentile measurement is that average latency can be misleading—if 95% of queries respond in 1 second but 5% take 20 seconds, users will notice and complain about the slow ones.
Cost per Query: Is this financially viable? RAG systems incur multiple costs: generating embeddings for the query, searching the vector database, and calling the LLM to generate the answer. For services like OpenAI’s GPT-4, API costs can add up quickly at scale. If you’re serving 10,000 queries per day and each costs $0.10, that’s $1,000 daily or $30,000 monthly. Professional teams track cost per query and set target thresholds based on business model—for example, keeping costs under 10% of customer lifetime value.
Cost optimization in 2025 often involves intelligent caching (storing answers to repeated questions), using smaller models for simple queries and reserving expensive models for complex ones, and optimizing prompts to reduce token usage. A well-tuned system might achieve 95% of the quality at 60% of the cost through these techniques.
User Feedback: What do real users think? All the automated metrics in the world don’t replace actual user satisfaction. Simple thumbs-up/thumbs-down ratings, star ratings, or follow-up questions like “Did this answer help?” provide invaluable ground truth. Professional systems aim for 80%+ positive feedback. When automated metrics look good but user feedback is poor, it’s a signal that your metrics aren’t measuring what actually matters to users.
The power of end-to-end metrics is combining them to make informed trade-offs. Maybe you can reduce latency from 3 seconds to 1.5 seconds by using a smaller model, but correctness drops from 92% to 85%. Is that trade-off worth it? End-to-end metrics give you the data to decide based on user needs and business requirements, not guesswork.
Why Continuous Monitoring Matters
Here’s a uncomfortable truth about RAG systems: they decay over time even when you don’t change anything. This “silent degradation” is why one-off testing before launch isn’t enough—you need continuous monitoring in production.
Why Quality Drifts: Several factors cause RAG performance to degrade silently. User query patterns shift (in 2024, many systems saw sudden influxes of questions about AI tools as the technology became mainstream). Your document corpus becomes outdated (company policies change, products are discontinued, regulations are updated). Embedding models and LLMs get updated by providers, subtly changing behavior. Even search indexes can accumulate inefficiencies over time. Unlike traditional software where bugs are obvious, RAG systems just quietly get worse at their job.
A real example: A financial services RAG system maintained 87% correctness for four months after launch. Then it dropped to 79% over two weeks. Without monitoring, this went undetected for a month until customers complained. Investigation revealed the embedding service had switched models, changing how queries were encoded. The new model performed worse on financial terminology. With continuous monitoring, this would have been caught within hours and fixed immediately.
The 2025 Monitoring Standard: According to current best practices, production RAG systems should run automated evaluations hourly on sampled traffic—typically evaluating 100 randomly selected queries per hour, which is about 1% sample rate for a system handling 10,000 queries per hour. This sampling approach keeps evaluation costs manageable (around 5% of production LLM costs) while providing high confidence in detecting quality regressions.
Modern monitoring uses reference-free metrics like faithfulness and answer relevancy that don’t require ground truth answers, making them practical for live traffic evaluation. Tools like RAGAS have made this straightforward to implement. Results are stored in time-series databases, enabling teams to visualize trends and set up automated alerts: “Page on-call engineer if faithfulness drops below 90% for 2 consecutive hours” or “Notify team Slack channel if retrieval recall degrades by more than 10%.”
Multi-Tier Alerting: Not all problems require the same urgency. Professional teams in 2025 typically use three alert tiers:
- Critical alerts (page on-call immediately): Hallucination rate exceeds 1%, system error rate spikes above 5%, or latency p99 violates SLA. These indicate immediate user impact.
- Warning alerts (Slack notification): Faithfulness score drops 5%+ from baseline, retrieval precision degrades 10%+, or cost per query increases significantly. These suggest problems that need investigation but aren’t actively breaking user experience yet.
- Information alerts (dashboard only): Gradual metric drift, new query patterns emerging, or cache hit rate changes. These inform weekly review meetings and planning.
Recent Advances: Research presented at ICLR 2025 introduced the concept of “sufficient context”—the ability to determine when a RAG system has enough retrieved information to answer correctly. This is helping teams optimize retrieval (stop searching when you have enough context) and detect when queries are unanswerable given the available corpus. Tools are evolving rapidly; frameworks like Langfuse, Weights & Biases Weave, and Arize AI provide comprehensive observability, while newer models like Lynx are improving hallucination detection in long-context scenarios.
The fundamental principle: RAG evaluation isn’t a checkbox before launch—it’s ongoing operational infrastructure, like monitoring CPU usage or database health. Teams that treat it as optional inevitably face quality incidents that damage user trust and require expensive firefighting. Teams that build monitoring from day one can confidently iterate on models, retrieval strategies, and prompts, knowing immediately if changes improve or degrade quality.
Conclusion
Understanding RAG performance metrics isn’t just for data scientists and engineers—it’s essential knowledge for anyone working with AI-powered systems. The three-window approach of evaluating retrieval quality (Recall@k, Precision@k, nDCG), generation quality (faithfulness, hallucination rate, answer relevancy), and end-to-end performance (correctness, latency, cost) provides a comprehensive framework for ensuring these systems actually work as intended. Each window reveals different problems: retrieval metrics tell you if the system is finding the right information, generation metrics show whether it’s using that information correctly, and end-to-end metrics confirm the complete system delivers value to users. Without all three perspectives, you’re essentially debugging with one eye closed.
If you’re building, using, or evaluating RAG systems, start by asking these questions: What’s our current faithfulness score? Are we monitoring for hallucinations? How do we know if retrieval quality degrades? If you can’t answer these questions, you’re flying blind. For teams just getting started, begin with simple reference-free metrics using tools like RAGAS—you don’t need a perfect gold dataset to start measuring faithfulness and answer relevancy. For organizations already running RAG in production, implement continuous monitoring with hourly sampling and multi-tier alerts. The investment pays for itself by catching quality regressions before they reach users.
The landscape is evolving rapidly. As we move through 2025, tools like Lynx and Vectara’s HHEM-2.1 are making hallucination detection more reliable, while research on “sufficient context” is helping optimize retrieval efficiency. But the fundamental principle remains unchanged: RAG systems require systematic measurement across multiple dimensions. The organizations succeeding with RAG technology aren’t necessarily those with the fanciest models—they’re the ones who measure rigorously, monitor continuously, and act quickly when metrics signal problems. Now that you understand what to measure and why it matters, you’re equipped to ask the right questions and demand the right safeguards from any RAG system you build or use.
Sources
- Mastering RAG Evaluation: Best Practices & Tools for 2025
- Google Research: Deeper insights into retrieval-augmented generation
- Evaluating RAG Systems in 2025: RAGAS Deep Dive, Giskard Showdown
- A complete guide to RAG evaluation
- RAG Evaluation Metrics Explained: Recall@K, MRR, Faithfulness
- RAG systems: Best practices to master evaluation for accurate and reliable AI
- Best Practices for Production-Scale RAG Systems
- RAG Evaluation Metrics: Assessing Answer Relevancy, Faithfulness, Contextual Relevancy
If you found this useful, feel free to connect on LinkedIn or check out my projects on GitHub.